Introduction
Technical analysis price action mastery is an essential skill for any Indian stock trader aiming to navigate the volatile markets successfully. Unlike fundamental analysis, which focuses on economic data and company performance, technical analysis relies on price movements and patterns to predict future market behavior. For novice traders in India, mastering price action is crucial to understanding key market signals without heavy dependence on indicators. In this article, we will explore how Indian investors can harness price action techniques to maximize returns in ₹ terms, whether trading equities, commodities, or currencies. With real-world examples and beginner-friendly tips, this guide empowers you to develop strong analytical skills vital for informed investment decisions.
Understanding Technical Analysis Price Action Mastery
What is Price Action in Technical Analysis?
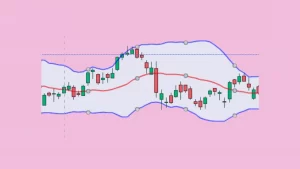
Price action refers to the movement of a security’s price plotted over time, often represented with candlestick charts, bar charts, or line charts. In India, stocks like Reliance Industries Ltd or Tata Motors show characteristic price action patterns that traders study to gauge market sentiment. Rather than relying on lagging indicators such as moving averages, technical price action focuses on raw price changes and patterns such as pin bars, inside bars, and engulfing candles. These formations help traders anticipate reversal points or continuation trends, critical in volatile markets like the NSE or BSE.
For instance, if Tata Steel shows a bullish engulfing pattern on the candlestick chart followed by increased volume, it may signal a strong buy opportunity. Understanding these subtle cues helps Indian traders avoid guesswork and make rational decisions that improve potential returns.
Technical analysis price action mastery involves training your eyes to recognize these patterns decisively. Experienced practitioners can interpret the psychology behind price moves, reflecting buyers’ and sellers’ strength at specific price levels, making the approach more nuanced than basic chart reading.
Key Tools for Technical Analysis Price Action Mastery
Essential Chart Types and Patterns
The most popular charts used in India for technical analysis are candlestick charts. Developed originally in Japan, candlestick patterns provide rich visual information about opening, closing, highs, and lows in a specific timeframe. Mastery includes learning common patterns like Doji, Hammer, and Evening Star, which often signify turning points in Indian stocks.
For example, a Doji appearing at the top of a price rally in the Indian currency market (INR/USD) may indicate indecision among traders and potential reversal. Similarly, recognizing head and shoulders or double-bottom patterns within NSE stock charts can confirm trend changes, giving traders timely entry or exit signals.
Besides patterns, volume analysis plays a complementary role in validating price action signals. If nifty fifty stocks see a breakout with rising volume, traders can be more confident in the upward trend. Hence, combining volume and price action strengthens analysis reliability.
Practical Indian Examples of Price Action Mastery
Case Study: Reliance Industries Ltd Price Action
Reliance Industries is one of the most actively traded stocks in India, and its price charts offer excellent learning opportunities. In early 2023, Reliance’s stock showed a clear ascending triangle pattern accompanied by increasing volumes. Price action traders identified this as a bullish formation, leading many to enter long positions near ₹2100 levels expecting a breakout.
When the stock breached ₹2200, the pattern confirmed upward momentum, rewarding knowledgeable traders. Price action mastery enables investors to spot such setups without relying on complex indicators or guesswork. This practical knowledge translates directly into tangible ₹ profits.
Moreover, during sudden market corrections, price action trading helped avoid heavy losses by signaling caution when bearish patterns like bearish engulfing appeared. Such disciplined strategies resonate well with salaried individuals looking for safe yet profitable ways to invest their SIP (Systematic Investment Plan) funds in mutual funds linked with equity markets.
Building Your Technical Analysis Price Action Skills
Step-by-Step Learning Approach
Beginners should start with basic candlestick chart reading and gradually move to more advanced patterns and price formation concepts. Using Indian market simulators or demo accounts from brokers such as Zerodha or Upstox provides hands-on experience with ₹100 virtual capital before risking real money.
Regularly reviewing NSE, BSE charts of popular scripts like Infosys, HDFC Bank, or ITC helps familiarize with recurring patterns. Combining daily news flow and price action observations sharpens Market Sense, critical for timely trades.
Joining financial education platforms or Indian forums focusing on technical analysis enriches learning through shared insights and local market contexts. Consistency in chart analysis and journaling trades improve awareness of mistakes and successes, accelerating mastery of technical analysis price action.
Common Mistakes to Avoid in Price Action Trading
Tips to Prevent Costly Errors
One common error is overtrading based on weak price signals, leading to unnecessary brokerage charges in Indian markets. Monitoring the Nifty or Sensex’s broader trend before trading individual stocks helps align decisions with macro conditions.
Another mistake is ignoring risk management. Indian traders should use stop-loss limits proportionate to the ₹ portfolio size to protect capital during unforeseen volatile swings. Price action trading does not guarantee success but when coupled with prudent money management, it improves sustainability.
Avoid excessive reliance on price patterns without checking volume confirmation or broader market news. Fundamental events like RBI policy changes or budget announcements cause shifts that technical patterns alone can’t predict fully.
Advanced Techniques in Technical Analysis Price Action Mastery
Incorporating Multi-Timeframe Analysis
Advanced traders often combine price action signals from different chart timeframes – daily, weekly, and intraday – to enhance reliability. For example, if a bullish pattern forms on the daily chart of ICICI Bank, confirming it on a 15-minute chart improves trade confidence.
This layered approach suits Indian intraday traders who juggle between positional and short-term trades to capitalize on ₹ market volatility. Multitimeframe analysis also provides better market context, reducing false signals and improving entry-exit timing.
Traders can also integrate price action mastery with limited indicators like RSI or MACD selectively for trend strength confirmation, maintaining simplicity while boosting accuracy. Such hybrid techniques are favored by seasoned Indian traders balancing technical rigor with market realities.
Conclusion
Mastering technical analysis price action is a valuable skill set for Indian investors aiming to enhance trading success with minimal reliance on complicated indicators. Understanding raw price movements empowers traders to anticipate market behavior across stocks, commodities, or currencies in ₹ terms. By continuously practicing chart reading, analyzing real Indian stock examples, and avoiding common pitfalls, beginners can build a robust decision-making framework resistant to market noise. Embracing multi-timeframe analysis and disciplined risk management further refines this mastery. Ultimately, technical analysis price action mastery combines art and science, providing Indian traders with an edge that translates into tangible financial growth in the dynamic Indian markets.
Frequently Asked Questions
What is technical analysis price action mastery?
Technical analysis price action mastery means understanding and interpreting price movements and chart patterns without relying heavily on indicators. It allows traders to predict market trends using raw price data, essential for Indian stock market participants seeking precise timing.
How can beginners start learning price action trading in India?
Beginners should begin by studying basic candlestick charts of popular Indian stocks, practicing on trading simulators offered by brokers like Zerodha, and gradually learning common patterns like pin bars or engulfing candles while applying risk management.
Can technical analysis price action work for Indian markets?
Yes, price action analysis is especially effective in Indian markets due to high volatility and liquidity. Recognizing pattern signals in stocks like Tata Steel or Reliance Industries helps traders make informed decisions aligned with local market dynamics.
What mistakes should Indian traders avoid in price action mastery?
Avoid overtrading, neglecting stop-losses, and ignoring volume confirmation. Also, never depend solely on price patterns during major economic or policy announcements in India, as fundamentals can override technical signals.
Is it necessary to use indicators with price action trading?
While price action focuses on pure price data, some Indian traders may combine minimal indicators (e.g., RSI or volume) to confirm trends. However, mastery lies in prioritizing price patterns without becoming indicator-dependent.
How important is risk management for price action traders in India?
Risk management is critical. Given Indian market volatility, traders must use appropriate stop-loss orders, position sizing, and diversify to protect their ₹ capital and sustain long-term profitability.
Can price action trading be used for intraday trades in India?
Absolutely. Intraday traders in NSE or BSE often use short-term price action setups combined with multi-timeframe analysis to exploit rapid price movements effectively during trading sessions.